In this post, we’ll be covering the use of the Windows Debugging framework to dig into application crashes that otherwise can’t be explained on a Windows machine.
Application crashes on Windows systems can be difficult to troubleshoot, especially when logs are limited or misleading. A common example is explorer.exe crashing repeatedly with the message that ntdll.dll is the cause. In reality, ntdll.dll is often just the last module on the stack, not the actual root cause of the crash.
In such cases, advanced debugging tools like WinDBG are essential for deeper analysis. This guide outlines a structured approach to collecting and analyzing Windows crash dump files using WinDBG to identify the real cause of application failures, particularly those related to shell extensions.
Prerequisites
Install WinDBG
Download and run the latest installer from Microsoft: https://developer.microsoft.com/en-us/windows/downloads/windows-sdk/
During installation, deselect all components except Windows Debugger. This minimizes installation time and reduces system impact.
Enabling Dump File Collection
To generate crash dumps for analysis:
On the affected workstation, apply the following registry file to enable dump file generation:
Windows Registry Editor Version 5.00

[HKEY_LOCAL_MACHINE\SOFTWARE\Microsoft\Windows\Windows Error Reporting\LocalDumps]
"DumpFolder"=hex(2):63,00,3a,00,5c,00,74,00,65,00,6d,00,70,00,00,00
"DumpType"=dword:00000002
"DumpCount"=dword:0000000a
Allow the crash (e.g., explorer.exe) to occur again.
After the crash, navigate to the following directory:
C:\Temp
Copy the generated .dmp file(s) to a workstation where WinDBG is installed. Avoid analyzing dump files directly over a network share as performance will be significantly degraded.
Analyzing the Dump File
Open WinDBG (x64) on your analysis workstation.
Drag the .dmp file into the debugger window to load it. It should look something like this:
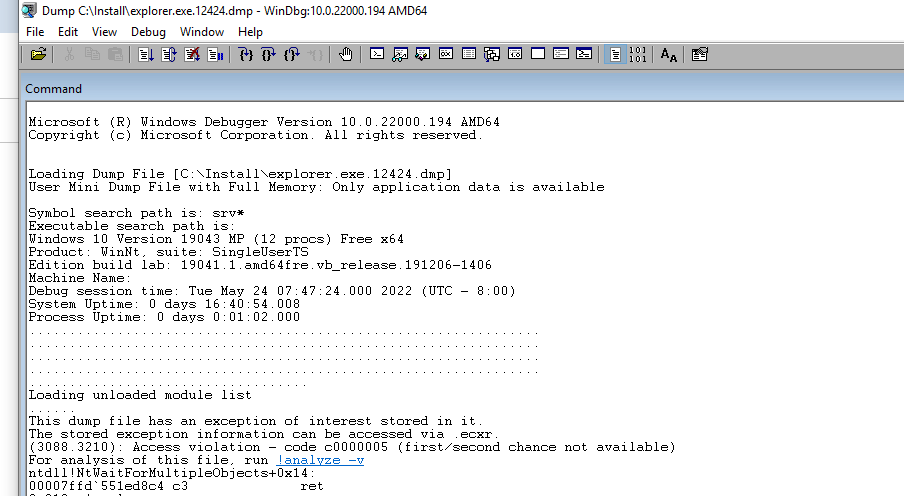
Once loaded, execute the following command in the command pane:
!analyze -v
WinDBG will begin analyzing the dump file and retrieving any required symbols from Microsoft’s symbol servers. This process may take several minutes depending on file size and symbol availability. For example, a 700 MB explorer.exe dump took approximately 5 minutes to complete on my workstation.
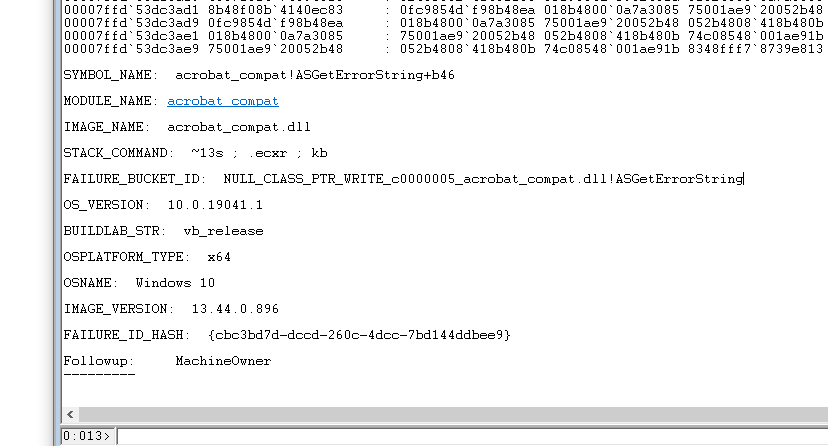
Once the analysis is complete and the debugger is no longer marked as BUSY, review the output. Focus on non-Microsoft modules identified as the faulting components. For instance, you might see something like:
Faulting module: acrobat_compat.dll
This module is part of Nitro PDF and is known to cause compatibility issues with Windows Explorer and other shell components.
Disabling Faulty Shell Extensions
If a third-party shell extension is identified as the cause of the crash, use the ShellExView utility to investigate and disable it: https://www.nirsoft.net/utils/shexview.html
Steps:
Launch the shexview.exe utility.
In the menu, select Options > Hide All Microsoft Extensions.
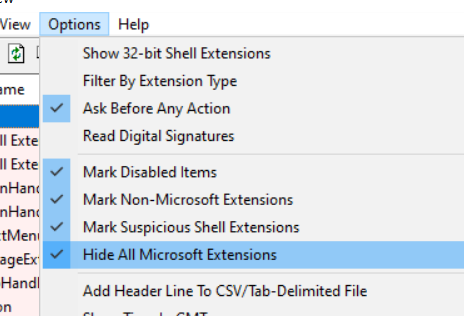
Review the list of third-party shell extensions.
Locate the problematic DLL identified in the crash analysis (e.g., acrobat_compat.dll).
Right-click the item and select Disable Selected Items.
Disabling non-Microsoft shell extensions is generally safe for diagnostic purposes. However, it may temporarily disable related features, such as thumbnail previews or file previews in Windows Explorer.
A system reboot may be required to fully apply the changes.
Disabling Dump Collection
After resolving the issue, revert the registry change to stop creating dump files on the affected machine using the following batch file (removing the key):
Windows Registry Editor Version 5.00

[-HKEY_LOCAL_MACHINE\SOFTWARE\Microsoft\Windows\Windows Error Reporting\LocalDumps]
Conclusion
WinDBG is a powerful tool for diagnosing Windows application crashes when traditional logging is insufficient. By collecting and analyzing memory dump files, administrators can pinpoint issues such as faulty shell extensions or incompatible third-party modules. This process enables quicker remediation and reduces reliance on trial-and-error troubleshooting.
Implementing this workflow can significantly improve the ability to respond to persistent or poorly understood system crashes in enterprise environments.